
Create meaningful discussions with the support of fact-based automated function point analysis (FPA). The FPA, together with time tracking data from your software teams, can provide useful metrics such as the productivity of your teams.
Visualize how much functionality gets added over time and get insights in how to balance product quality and speed of development. Support the choice of a specific technology with facts on development speed and software quality.
The improved function point analysis BonCode offers combined with time tracking administration provides key insights:
- Functional Growth
- Speed of Development
By monitoring functional size and combining this data with time tracking data customers can get productivity metrics. These metrics can be used to compare the productivity of teams using traditional technologies with teams using low-code platforms (such as OutSystems). The process is automated and consists of three steps:
1. Measure function size periodically
The function point analysis conducted at BonCode can be done automatically and periodically. In agile projects, there is seamless integration with the sprint cycle. It assigns a numerical value to functional items such as inputs / outputs and logical files.
All these items get counted and that’s the functional size data we need. When we measure periodically, a trend arises that shows how the functional size of the project changes over time.
2. Determine changes in functionality
For each measurement the function points are classified. BonCode uses three categories: added, removed and changed. This can be visualized:
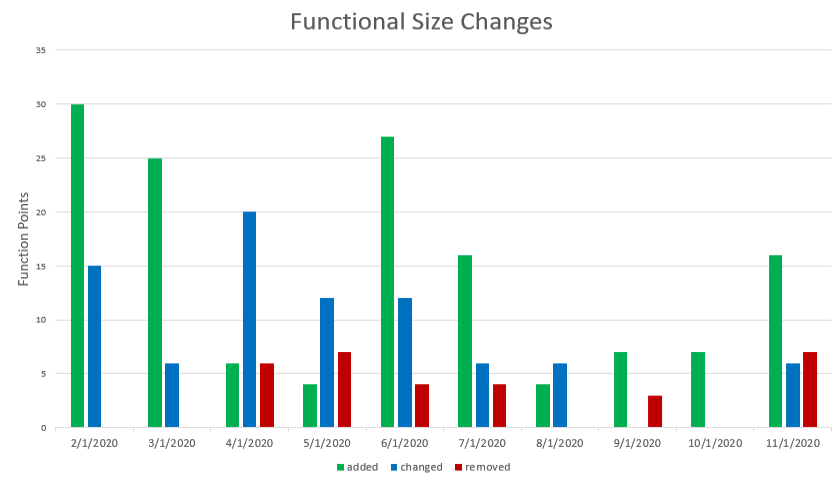
The classification is needed because added functionality costs more time to develop than removing functionality. But removing functionality also requires some time. The process determines the size of each change. The size of the changes corresponds to a weight factor that is used to determine the impact on the total functional size.
These visualizations, together with a range of software quality metrics, are available in dashboards that provide insights to all levels of management.
3. Determine the productivity
In order to come to a productivity metric, we combine time tracking data with functional size data. When provided with this data, a productivity trend emerges from the two datasets. An example:
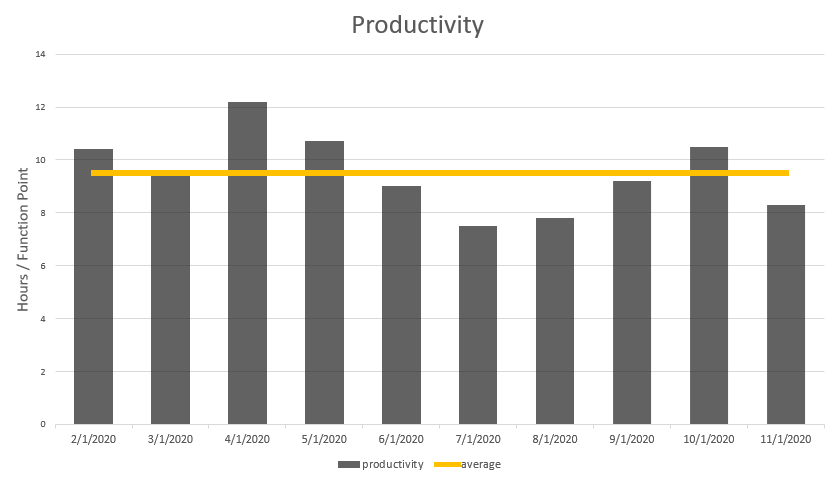
The productivity metrics BonCode tracks use the function points from the FPA calculation. These are based on the ISO standard for Function Point Analysis.


